
Quantitative researchers aim to explore as well as understand the various characteristics of a population with the help of parameters. Parameters are referred as numbers that are used to summarize an entire population, while statistics are the numbers that are used to summarize data deduced from a sample. Also, a population’s characteristic is referred to as a parameter whereas, a sample’s characteristic is called statistic.
Population and Sample in Statistics
Population
The term “population” has a slightly different connotation in statistics than it does in everyday speech. In research, a population is a whole collection of items connected by a common parameter.
Population can refer to both people and things. For instance:
- All Britain’s who played soccer in last two years
- All members of ABC Union
- All students at a particular research institute
Or,
- Complete set of temperatures recorded for a particular city in a particular month
- All products from a certain company
- All bone cells from a particular lab monkey
Sample
A sample is a subset of a population that has been chosen to reflect the entire population. The sample must be random in order to utilize statistics to learn about the population. Every member of a population has an equal probability of being chosen in a random sampling.
As a population contains a large number of individuals, so a convenient study is not feasible. That is why, so we limit the study to one or more samples drawn at random from the same population.
A sample that is well chosen will include the majority of the information on a given parameter of the population, but the sample-to-population relationship must be such that genuine population inferences may be drawn from the sample.
| Sample | Population |
| · The quality which can be measured from a sample is called statistic. | · The quality which can be measured from a population is called parameter. |
| · The reports have a margin of error and confidence interval, therefore. | · The reports exhibit accurate representations of public opinion. |
| · A sample is a subset of population. | · A population is a whole set. |
| · It is a subset reflecting the whole population. | · All individuals of a specific group are included in a population. |
What is Statistic?
Statistics is the branch of mathematics concerned with the gathering, tabulation and interpretation of numerical data. Also, it is defined as numerical data. A report of figures indicating the number of believers of each religion in a given nation is an example of statistics. A math class provided in high schools and universities is another example of statistics.
A statistic is a single item in a statistical study. It is a quantity computed from data in a sample, taken at random from a population, that characterizes a key feature of the sample. Examples of some common statistic are mean or standard deviation. The reports have a margin of error and confidence interval, therefore.
There two common kinds of statistical analyses methods that are frequently used to analyze data:
- Descriptive statistics
- Inferential statistics
To produce descriptive statistics, statisticians measure, gather, and analyze data about individuals or aspects of a sample. They can then use the visible properties of the sample data, which are technically called “statistics,” to make inferences or educated guesses about the unquantified, or quantified, aspects of the larger population which are known as the parameters.
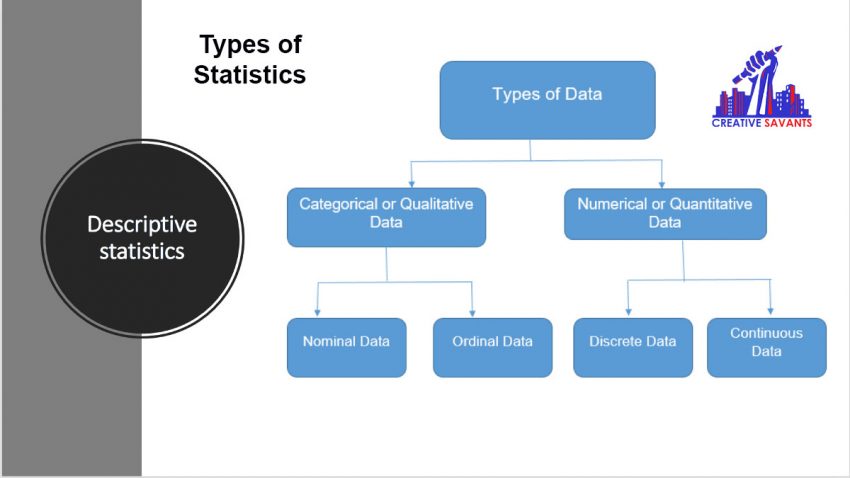
Descriptive Statistics
The central tendency, variability, and distribution of the sample data are the primary concerns of descriptive statistics.
The central tendency is the estimation of the characteristics, which is a common aspect of a sample or population. The mean, median, and mode are examples of descriptive statistics.
Variability is a collection of statistics which illustrate the variation in the properties which are being studied of the sample or population. It includes metrics such as standard deviation, variance and range.
Inferential Statistics
Statisticians utilize inferential statistics to derive inferences about population features by using certain attributes of a sample. It helps to determine how certain they may be about the accuracy of these conclusions.
Inferential statistics are employed for generalization in large groups, for example, to estimate average demand for a product by examining a sample of buying customers’ habits or to attempt to predict events in the near future such as projection in sampled period of a future return of a security or asset class.
Parameter in Statistics
A parameter is considered a useful statistical analytical component. It describes the qualities needed to characterize a certain demographic. A specific feature of the entire population is described. The parameter is unknown when constructing a population inference since collecting information from every member of the population would be impractical. Rather, we obtain a conclusion about the parameter using a statistic from a sample of the population.
Let’s say, if we want to describe the mean number of scholarships awarded to the students of XYZ institution, we can use a parameter for the purpose. The researchers should evaluate the scholarship awarded to about ten students or in other words, a few select samples of the population. This is assuming that the institute has a population of about 3000 students. If the researchers take three samples of 10 students, the mean may be obtained as $2,000, $1,200, and $800. This sample mean can be helpful to the researcher in making an inference about the population parameter.
Common Parameters
Measures of central tendency are among the most often utilized parameters. These measurements are used to explain how data behaves in a distribution, and they include mean, median, and mode.
Mean
The mean, often known as the average, is the most popular of the three central tendency measurements. The parameter is used by researchers to explain the distribution of ratios and intervals in data.
Summing and then dividing the results by the number of scores yields the mean. The mean of five kitchens with 7, 4, 3, 6, and 1 chef, for example, may be computed as follows:
= (7+4+3+6+1)/5
=21/5
=4.2
Median
Variables assessed on interval, ordinal, or ratio scales are calculated using the median. The data is arranged from the smallest to largest and then the number(s) in the center is selected. The median is generally the middle value when the total number of data points is an odd number.
In case of even numbers, the mean is achieved when the two values in the center are summarized and divided by two to get the average or mean. When there are a few distinct data points, the median is usually applied. When determining the median of students attending college, for example, there may be a group of students who are older than the others. The data maybe distorted if only mean is used, as it will imply a higher age for students attending college. Hence, use of median can provide a more accurate picture of the issue.
in the example given, the median age of students going to college for the first time will be calculated as follows. The values of ten students are as follows
18, 20, 19, 18, 17, 19, 18, 19, 17, 19
So, the median value is (17+19)/2 = 18
Mode
Within a data distribution, the mode is the most often occurring number. It displays the highest or most common number or value in the data distribution. Any form of data can be entered into the mode.
For example, let’s say there are 40 patients of influenza. Temperature of each of them is recorded and then they are grouped on a scale of 99-104 degree Celsius.
- Group 1: 9
- Group 2: 8
- Group 3: 12
- Group 4: 14
- Group 5: 4
As the group 3 shows the most people, therefore the mode of this data is 14. It shows that out of the forty patients, most of them were falling in group 4.
Parameter vs Statistic
A parameter is used if an entire population under study is to be described. Lets say, if we want to know the average height of dogs, we will call it a parameter as it is telling us something about the complete dog population.
Although parameters are tough to come by, we can approximate their value by using the relevant statistic. A statistic refers to a subset of a population, whereas a parameter refers to the complete population.
We can only capture and measure a hundred dogs since catching and measuring all of the dogs in the world is impossible. We may deduce the length of the total population of dogs from the mean length of the hundred dogs. This mean length of dog population is a statistic.
A statistic’s value often varies from one sample to the next, but the parameter remains constant.
One sample of hundred dogs, for example, may have an average length of 100 cm, whereas another sample of 100 butterflies from a different location may have an average length of 95 cm. Also, a smaller sample of fifty dogs with an average length of 115 cm is possible.
The parameter of the full population may then be estimated using the statistic derived from the sample of the population.
Statistical Notation
In order to indicate how a population or a sample of that population is being referred to, different symbols are used for statistics vs parameters. The populations are generally referred to in Greek letters and in capital letters, whereas samples are referred to in Latin letters and lower cases.
Notations for statistic vs parameter |
||
| Population parameter | Sample statistic | |
| Proportion | P | p̂ (called “p-hat”) |
| Mean | μ (Greek letter “mu”) | x̄ (called “x-bar”) |
| Variance | σ2 | s2 |
| Standard deviation | σ (Greek letter “sigma”) | s (Latin letter “s”) |
Making an Educated Guess about Parameters from Statistics
To make an educated guess, or estimating population parameters from sample statistics, the use of inferential statistics is recommended. However, the sample should preferably be representing the population or must be randomly picked in order to provide unbiased estimations.
You may generate point estimates and interval estimates for the population parameter. These two types of estimates are discussed below:
Point Estimate
A single value estimate of a parameter based on a statistic is known as a point estimate. A sample mean, for example, is a population mean’s point estimate.
Interval Estimate
An interval estimate provides with a number of possible values for the parameter. The most frequent form of interval estimate is a confidence interval.
In order to clearly understand the accurate value of a parameter, both kinds of estimations are necessary.
Using a Sample Statistic to Estimate a Population Parameter
For example, you discover that 61 percent of participants in your sample favor the legalization of marijuana in your study on support of legalization of marijuana for medicinal purposes in US. So, construct a point estimate and then also an interval estimate from the sample statistic to guess the population parameter.
The sample statistic is your point estimate: you estimate that 63 percent of all Americans are in favor of legalization of marijuana for medicinal purposes.
You create a 95 percent confidence interval to obtain the interval estimate, which informs that where the population parameter is anticipated to lay mostly. The real population parameter for support of legalization of marijuana for medicinal purposes in US falls between 57 percent and 65 percent, provided that the sampling is random.
Frequently Asked Questions (FAQs)
What are the fundamental statistics terms?
Population, sample, parameter, and statistic are four important concepts in statistics A statistic is a numerical feature of a sample that is used to estimate or evaluate a population parameter, for example, a sample mean or proportion.
In statistics, what role do parameters play?
In statistics, parameters are an integral part of any statistical study. A parameter, in basic terms, is any numerical number that characterizes a population or a part of it. This indicates that the parameter provides information about the whole population.
What are the three most frequent statistical parameters?
They’re also known as dispersion measures. The range, standard deviation, and variance are the three most frequent variation parameters.
What is the purpose of using samples in research?
Inferences regarding populations are made from samples. Because samples are practical, cost-effective, easy, and controllable, they are simpler to gather data from.
Who makes use of statistics?
Statistics are frequently utilized in a variety of applications and occupations. Statistics are provided whenever data are gathered and examined. This might range from public bodies to university research to investment analysis.
What makes descriptive statistics different from inferential statistics?
The mean, standard deviation, and frequency of a variable are all examples of descriptive statistics. They are used to describe or summarize the features of a sample or data collection.
Inferential statistics, on the other hand, uses a variety of approaches to connect variables in a data set, such as correlation and regression analysis. These can then be utilized to make predictions or draw conclusions about causation.
Therefore, in order to get help and to use our services, Feel free to Contact Us or you can directly messaging us on WhatsApp. You may also know in detail about our services on our Services Page.